Environment Monitoring System Components
Updated: 29Aug2024 05:47:10 UTC 2024-08-29T05:47:10Z
Rating: (0 reviewsThis article has not been rated yet)
An environmental monitoring system can record and display indoor/outdoor ambient temperature, humidity, pressure, and/or air quality.
The basic components of an environmental monitoring system consists of a sensor, microcontroller (MCUMicrocontroller Unit), wireless transceiver (RFRadio Frequency or WiFi), and a computer. An additional option would be to include a sensor status indicator (e.g., LEDLight Emitting Diodes, LCDLiquid Crystal Display, or other visual display) near the sensor to visually indicate if the sensor is operational and interacting with the microcontroller.
The environmental sensor can produce either an analog or digital signal that is read by a microcontroller where the embedded software responds by sending a wireless signal over WiFi (LANLocal Area Network) or RF to a gateway computer to record the data.
Having measurements recorded on a computer allows the data to be displayed on a dashboard in real-time, along with the capability of setting up an alert notification either on the computer or sending a notification remotely by phone texts and/or email.
This overview of environment monitoring system components covers sensors, microcontrollers, transceivers, communication, and computer hardware and software.
Sensors
The environmental sensors that will be covered can measure temperature, humidity, pressure, and/or air quality.
- Temperature:
- Monitoring outdoor temperature is useful for determining if conditions are suitable for pets/animals/plants or outdoor activities. Monitoring indoor temperature is useful for maintaining a stable and comfortable environment. Measuring the temperature in each room throughout your home can help determine the appropriate settings on your thermostat. If you live in a cold environment with freezing temperatures, monitoring your house temperature while you are away is crucial for ensuring your pipes do not freeze.
- Humidity:
- The humidity sensors discussed here measure percent relative humidity (%RHRelative humidity measures the percentage of water vapor content in the air at a specified temperature. It is relative to the maximum possible amount of water vapor the air can hold at that temperature. ), which is the percentage of water vapor content in the air at a specified temperature relative to the maximum possible amount of water vapor the air can hold at that temperature. This is useful indoors for maintaining a comfortable environment and for plants.
- Pressure:
- Measuring air pressure outside can determine whether a storm is approaching. The difference between the outside and indoor air pressure can reveal if your home has balanced air pressure. If the pressure isn't balanced, the house will be sucking air in (negative air pressure) or forcing air out (positive air pressure), which can cause an increase in heating/cooling costs.
- Air Quality:
- The air quality sensors discussed here measure the total amount of Volatile Organic Compounds (VOCVolatile Organic Compounds) in the air, such as Ethanol, Alcohol, and Carbon Monoxide. VOC air quality sensors contain a heated metal oxide that changes its resistance depending on the amount of VOCs, and outputs one resistance value giving you the overall VOC content (it cannot differentiate different gases). The amount of VOCs is relative to a baseline value that you establish under normal conditions.
Five different types of environmental sensors will be covered that are defined by what physical quantities they can measure.
- Temperature
- Temperature/Humidity
- Temperature/Pressure
- Temperature/Humidity/Pressure
- Temperature/Humidity/Pressure/Air Quality
Temperature
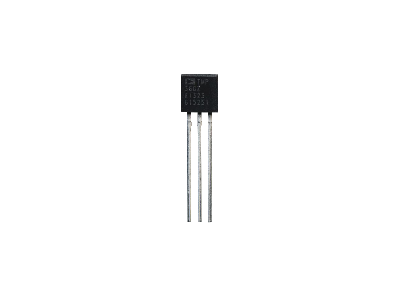
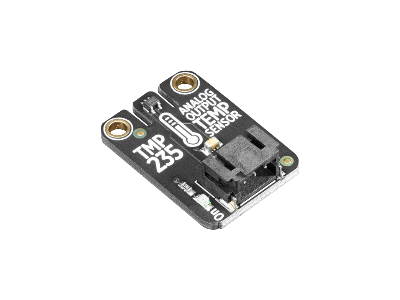
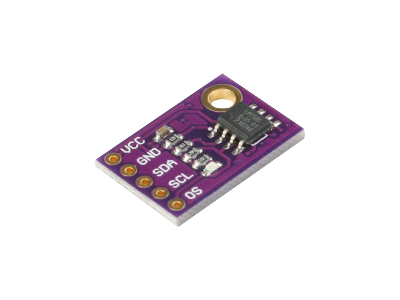
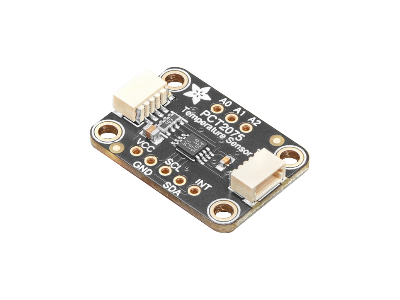
Semiconductor ICIntegrated Circuit temperature sensors are commonly used for measuring ambient temperature where the pn-junction of a diode or bipolar transistor has a strong thermal dependence. These sensors are very linear and are easy to interface, which can have an analog output proportional to the temperature (e.g., 10mV/°C) or they may have an internal ADCAnalog-to-Digital Converter (ADC, A/D, or A-to-D) that outputs digital data over I2CInter-Integrated Circuit. Also referred to as IIC or I2C. or 1-Wire1-Wire is a half-duplex serial protocol using a single data line plus ground reference for communication..
| IC | Temperature Range |
Accuracy | Operating Voltage |
Output | Datasheet |
|---|---|---|---|---|---|
| TMP235 | -50°C to +125°C | ±2.5°C | +2.3V to +5.5V DC | 10mV/°C | TMP235 Datasheet (PDF) |
| TMP36 | -40°C to +125°C | ±2°C | +2.7V to +5.5V DC | 10mV/°C | TMP36 Datasheet (PDF) |
| LM335 | -40°C to +100°C | ±2°C | +2.95V to +3.01V DC | 10 mV/°K | LM335 Datasheet (PDF) |
| LM34 | -45°C to +148°C (-50°F to +300°F) |
±0.56°C (±1.5°F) |
+5V to +30V DC | 10 mV/°F | LM34 Datasheet (PDF) |
| LM35DZ | 0°C to +100°C | ±0.5°C | +4V to +30V DC | 10mV/°C | LM35DZ Datasheet (PDF) |
| IC | Temperature Range |
Accuracy | Resolution | Operating Voltage |
COMCommunication | Datasheet |
|---|---|---|---|---|---|---|
| LM75B | -55°C to +125°C | ±2°C | ±0.125°C | +3.0V to +5.5V DC | I2C | LM75B Datasheet (PDF) |
| PCT2075 | -55°C to +125°C | ±2°C | ±0.125°C | +2.7V to +5.5V DC | I2C | PCT2075 Datasheet (PDF) |
| DS18B20 | -55°C to +125°C | ±0.5°C | ±0.0625°C Configurable |
+3V to +5.5V DC | 1-Wire | DS18B20 Datasheet (PDF) |
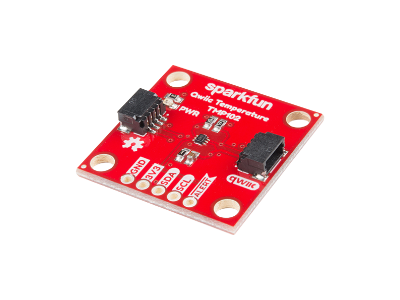
| TMP102 | -55°C to +150°C | ±0.5°C | ±0.0625°C | +1.4V to +3.6V DC | I2C | TMP102 Datasheet (PDF) |
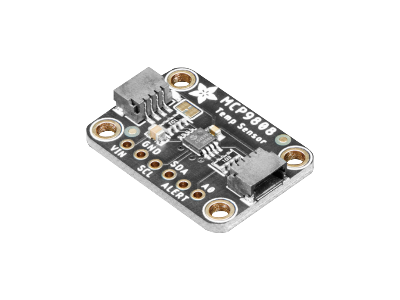
| MCP9808 | -40°C to +125°C | ±0.25°C | ±0.0625°C Configurable |
+2.7V to +5.5V DC | I2C | MCP9808 Datasheet (PDF) |
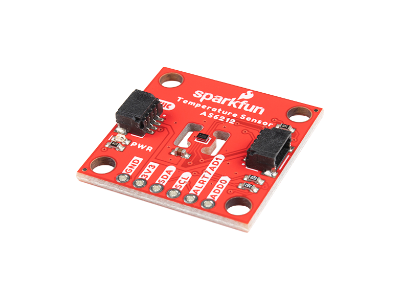
| AS6212 | -40°C to +125°C | ±0.2°C | ±0.0078°C | +1.7V to +3.6V DC | I2C | AS6212 Datasheet (PDF) |
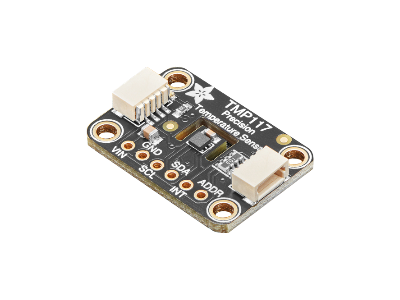
| TMP117 | -55°C to 155°C | ±0.1°C | ±0.0078°C | +1.8V to +5.5V DC | I2C | TMP117 Datasheet (PDF) |
Temperature/Humidity
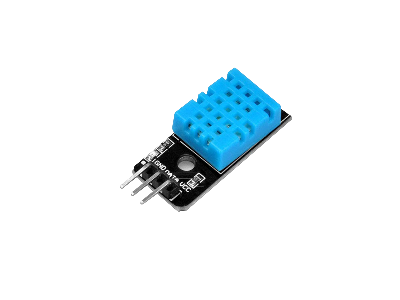
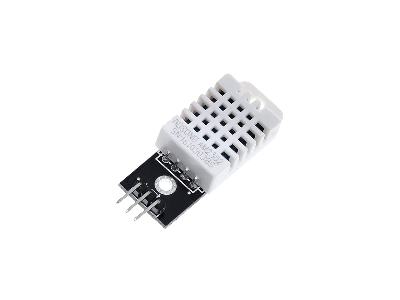
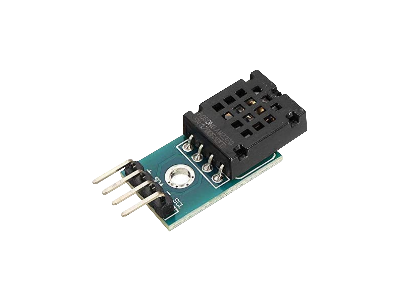
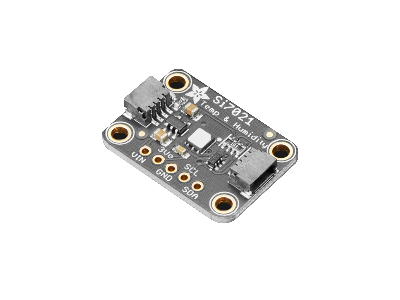
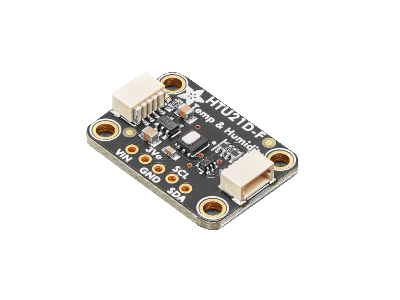
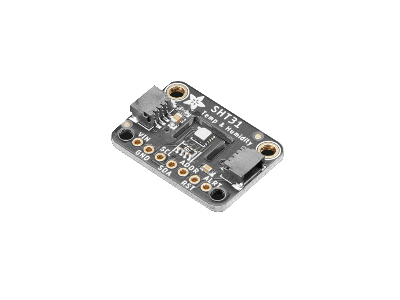
Temperature/Humidity sensors typically combine an I2CInter-Integrated Circuit. Also referred to as IIC or I2C. thermistor or semiconductor temperature sensor to measure ambient temperature and capacitive humidity sensor to measure the percent relative humidity (%RHRelative humidity measures the percentage of water vapor content in the air at a specified temperature. It is relative to the maximum possible amount of water vapor the air can hold at that temperature. ).
This combined package also contains an ICIntegrated Circuit that reads in the analog signals from the two sensors with an ADCAnalog-to-Digital Converter (ADC, A/D, or A-to-D), processes the data using stored calibration coefficients, then outputs a digital signal containing the temperature and relative humidity.
| Model | Temperature Range & Accuracy |
Humidity Range & Accuracy |
Operating Voltage |
COMCommunication | Datasheet |
|---|---|---|---|---|---|
| DHT11 |
Range:
0°C to +50°C
Accuracy:
±2°C |
Range:
20% to 90% RH
Accuracy:
±5% RH |
3.5V to 5.5V DC | 1-Wire | DHT11 Datasheet (PDF) |
| DHT22 / AM2302 |
Range:
-40°C to +80°C
Accuracy:
±0.5°C |
Range:
0% to 100% RH
Accuracy:
±2% to ±5% RH |
3V to 5V DC | 1-Wire | DHT22 / AM2302 Datasheet (PDF) |
| DHT12 / AM2320 |
Range:
-40°C to +80°C
Accuracy:
±0.5°C |
Range:
0% to 99.9% RH
Accuracy:
±3% RH |
3.1V to 5.5V DC | 1-Wire | DHT12 / AM2320 Datasheet (PDF) |
| Si7021 |
Range:
-40°C to +125°C
Accuracy:
±0.4°C |
Range:
0% to 100% RH
Accuracy:
0% to 80% RH with ±3% RH |
1.9V to 3.6V DC | I2C | Si7021 Datasheet (PDF) |
| HTU21D |
Range:
-30°C to +90°C
Accuracy:
±1°C |
Range:
0% to 100% RH
Accuracy:
5% to 95% RH with ±2% RH |
1.9V to 3.6V DC | I2C | HTU21D Datasheet (PDF) |
| SHT31 |
Range:
-40° to +125°C
Accuracy:
±0.3°C |
Range:
0% to 100% RH
Accuracy:
±2% RH |
2.4V to 5.5V DC | I2C | SHT31 Datasheet (PDF) |
Temperature/Pressure
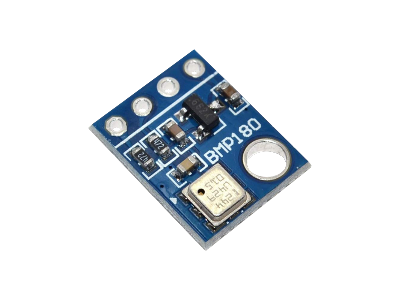
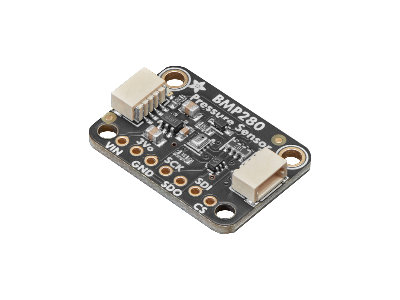
Temperature/Pressure sensors typically combine a semiconductor temperature sensor to measure ambient temperature and barometric pressure sensor to measure the pressure in hectopascals hPa (1hPa = 100Pa).
This combined package has an ICIntegrated Circuit that reads in the analog signals from the two sensors with an ADCAnalog-to-Digital Converter (ADC, A/D, or A-to-D), processes the data using stored calibration coefficients, then outputs a digital signal containing the temperature and pressure.
| Model & Datasheet |
Temperature Range & Accuracy |
Pressure Range & Accuracy |
COMCommunication | Datasheet |
|---|---|---|---|---|
| BMP180 |
Range:
0°C to +65°C
Accuracy:
±0.5°C (at 25°C) |
Range:
300hPa to 1100hPa
Absolute Accuracy:
±2.0hPa
Relative Accuracy:
±0.12hPa
Resolution:
±1Pa |
I2C | BMP180 Datasheet (PDF) |
| BMP280 |
Range:
-40°C to +85°C
Accuracy:
±1.0°C |
Range:
300hPa to 1100hPa
Absolute Accuracy:
±1.0hPa
Relative Accuracy:
±0.12hPa
Resolution:
±0.16Pa |
I2C/SPI | BMP280 Datasheet (PDF) |
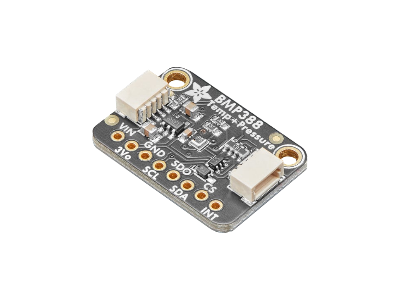
| BMP388 |
Range:
-40°C to +85°C
Accuracy:
±0.5°C |
Range:
300hPa to 1250hPa
Absolute Accuracy:
±0.5hPa
Relative Accuracy:
±0.08hPa
Resolution:
±0.016Pa |
I2C/SPI | BMP388 Datasheet (PDF) |
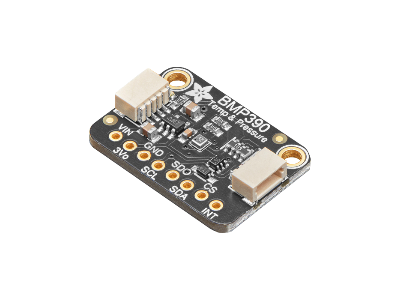
| BMP390 |
Range:
-40°C to +85°C
Accuracy:
±0.5°C |
Range:
300hPa to 1250hPa
Absolute Accuracy:
±0.5hPa
Relative Accuracy:
±0.03hPa
Resolution:
±0.016Pa |
I2C/SPI | BMP390 Datasheet (PDF) |
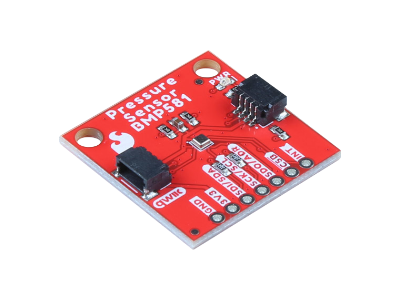
| BMP581 |
Range:
-40°C to +85°C
Accuracy:
±0.5°C |
Range:
300hPa to 1250hPa
Absolute Accuracy:
±0.75hPa
Relative Accuracy:
±0.06hPa
Resolution:
±0.016Pa |
I2C/SPI | BMP581 Datasheet (PDF) |
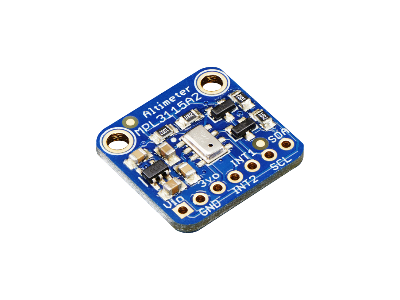
| MPL3115A2 |
Range:
-40°C to +85°C
Accuracy:
±1°C |
Range:
500hPa to 1100hPa
Absolute Accuracy:
±4hPa
Relative Accuracy:
±0.5hPa
Resolution:
±1.5Pa |
I2C | MPL3115A2 Datasheet (PDF) |
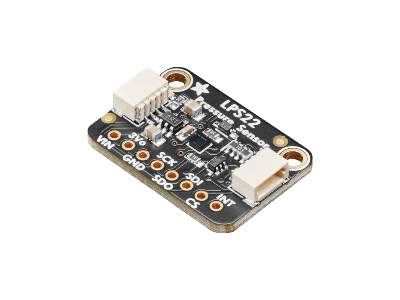
| LPS22HB |
Range:
-40°C to +85°C
Accuracy:
±1.5°C (0°C to +65°C) |
Range:
260hPa to 1260hPa
Absolute Accuracy:
±1hPA (before OPCOne-Point Calibration) ±0.1hPA (after OPCOne-Point Calibration)
Relative Accuracy:
±0.1hPa
Resolution:
±0.75Pa |
I2C/SPI | LPS22HB Datasheet (PDF) |
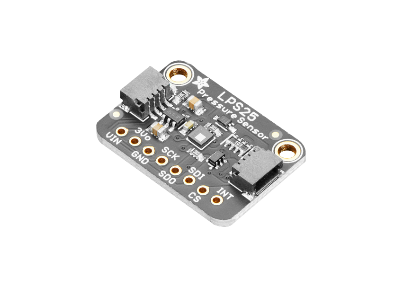
| LPS25HB |
Range:
-30°C to +105°C
Accuracy:
±2°C (0°C to +65°C) |
Range:
260hPa to 1260hPa
Absolute Accuracy:
±1hPA (before OPCOne-Point Calibration) ±0.2hPA (after OPCOne-Point Calibration)
Relative Accuracy:
±0.1hPa
Resolution:
±1Pa |
I2C/SPI | LPS25HB Datasheet (PDF) |
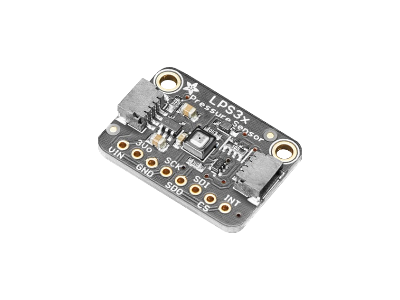
| LPS35HW |
Range:
-40°C to +85°C
Accuracy:
±1.5°C (0°C to +65°C) |
Range:
260hPa to 1260hPa
Absolute Accuracy:
±4hPA (before OPCOne-Point Calibration) ±1hPA (after OPCOne-Point Calibration)
Relative Accuracy:
±0.1hPa
Resolution:
24bit |
I2C/SPI | LPS35HW Datasheet (PDF) |
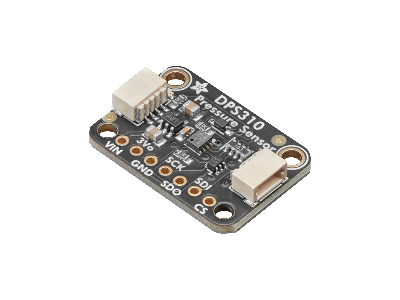
| DPS310 |
Range:
-40°C to +85°C
Accuracy:
±0.5°C |
Range:
300hPa to 1200hPa
Absolute Accuracy:
±1.0hPa
Relative Accuracy:
±0.06hPa
Resolution:
±0.2Pa |
I2C/SPI | DPS310 Datasheet (PDF) |
Temperature/Humidity/Pressure
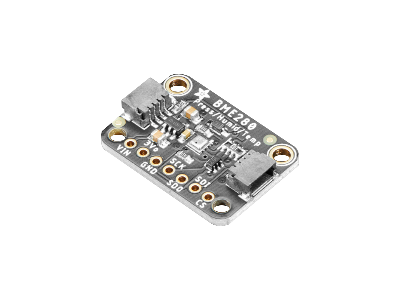
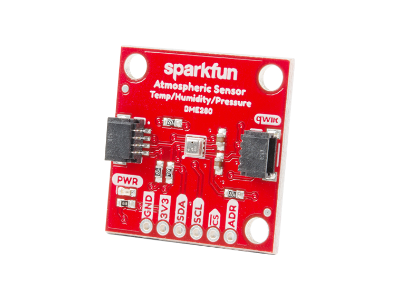
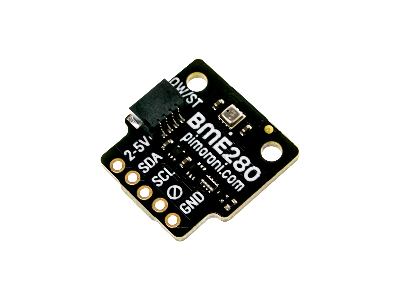
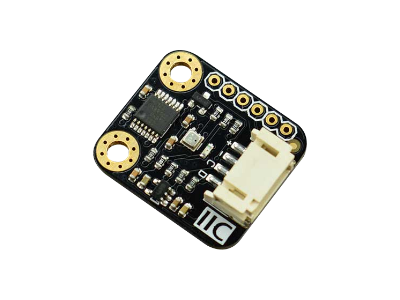
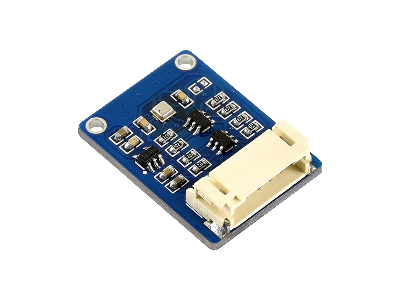
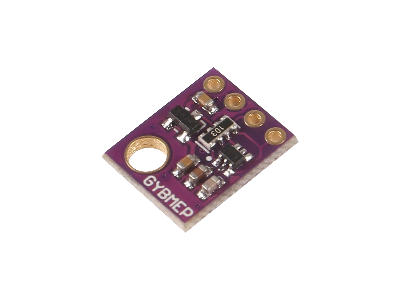
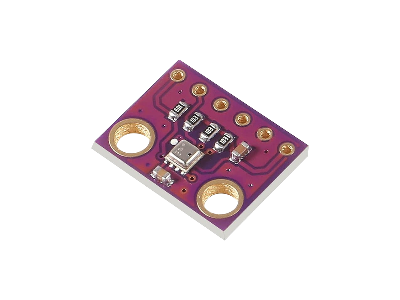
The Bosch BME280 Temperature/Humidity/Pressure sensor integrates a semiconductor temperature sensor to measure ambient temperature, a capacitive humidity sensor to measure the percent relative humidity (%RH), and a barometric pressure sensor to measure the pressure in hectopascals hPa (1hPa = 100Pa).
This combined package has an IC that reads in the analog signals from the three sensors with an ADC, processes the data using stored calibration coefficients, then outputs a digital I2CInter-Integrated Circuit. Also referred to as IIC or I2C. or SPISerial Peripheral Interface signal containing the temperature, humidity, and pressure.
| Model & Datasheet |
Temperature Range & Accuracy |
Humidity Range & Accuracy |
Pressure Range & Accuracy |
COMCommunication | Datasheet |
|---|---|---|---|---|---|
| BME280 |
Range:
-40°C to +85°C
Accuracy:
±1.5°C (-40°C to -20°C) ±1.25°C (-20°C to 0°C) ±0.5°C (0°C to +65°C) |
Range:
0 to 100% RH
Accuracy:
±3% (from 20% to 80% RH)
Resolution:
0.008%RH |
Range:
300hPa to 1100hPa
Absolute Accuracy:
±1.7hPa (-20°C to 0°C) ±1hPa (0°C to +65°C)
Relative Accuracy:
±0.12hPa
Resolution:
±0.18hPa |
I2C/SPI | BME280 Datasheet (PDF) |
Temperature/Humidity/Pressure/Gas
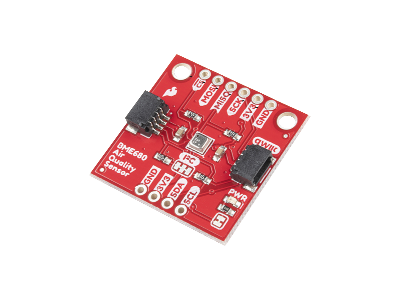
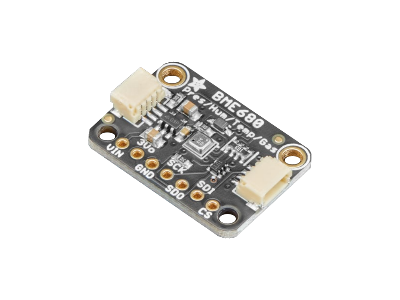
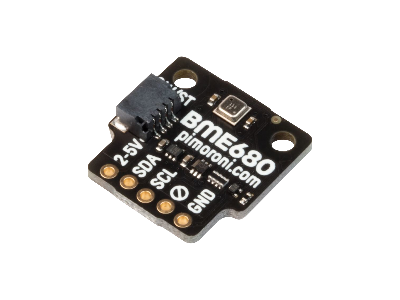
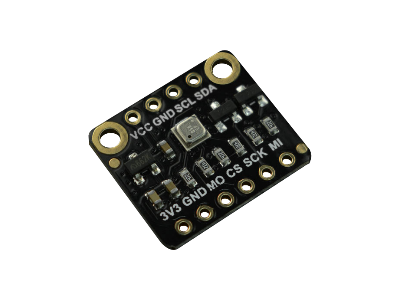
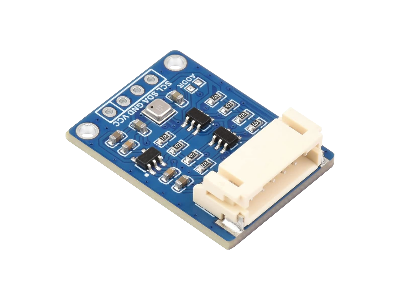
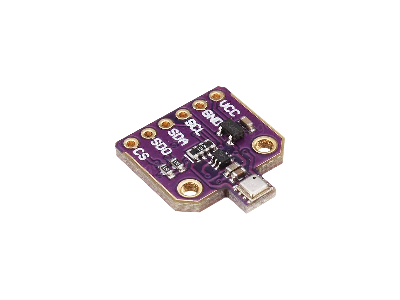
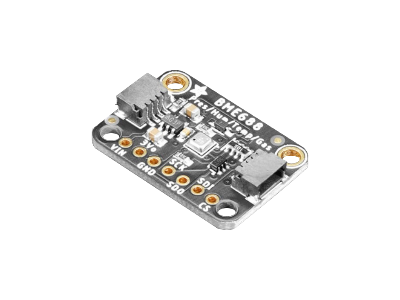
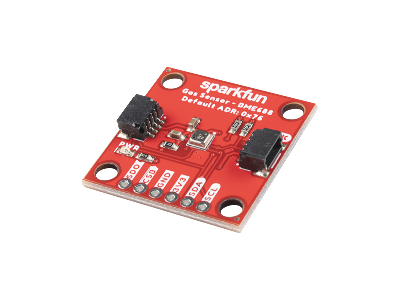
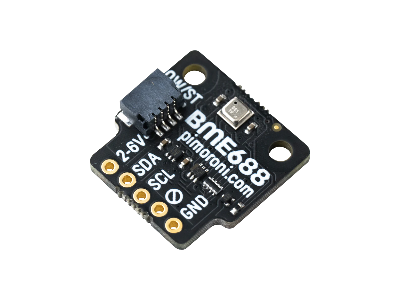
The BME680 environmental sensor from Bosch is a 4-in-1 integrated sensor that contains temperature, humidity, barometric pressure, and Volatile Organic Compounds (VOCVolatile Organic Compound) gas air quality sensing capabilities in the same package.
The BME680 has a small Metal Oxide (MOXMetal-Oxide) sensor, where the heated metal oxide changes its resistance depending on the amount of VOCs, such as Ethanol, Alcohol, and Carbon Monoxide, in the air. The output of the MOX sensor is one resistance value giving you the overall VOC content (it cannot differentiate different gases).
The BME688 environmental sensor from Bosch is an updated drop-in replacement for the BME680 with the additional gas scanning functionality to detect the presence of Volatile Sulfur Compounds (VSCVolatile Sulfur Compoundss) such as Hydrogen Sulfide (H2S) compounds and the capability of programming the gas sensor for controlled odor-analysis.
| Model & Datasheet |
Temperature Range & Accuracy |
Humidity Range & Accuracy |
Pressure Range & Accuracy |
Gas Resistance Sensor |
COMCommunication | Datasheet |
|---|---|---|---|---|---|---|
| BME680 |
Range:
-40°C to +85°C
Accuracy:
±0.5°C (+25°C) ±1.0°C (0°C to +65°C) |
Range:
0 to 100% RH
Accuracy:
±3% (from 20% to 80% RH)
Resolution::
±0.008% RH |
Range:
300hPa to 1100hPa
Absolute Accuracy:
±0.6hPa (0°C to +60°C)
Relative Accuracy:
±0.12hPa
Resolution:
±0.18Pa |
Resolution:
0.08% (typical) 0.11% (max)
Noise:
1.5% RMS (typical) |
I2C/SPI | BME680 Datasheet (PDF) |
| BME688 |
Range:
-40°C to +85°C
Accuracy:
±0.5°C (0°C to +65°C) |
Range:
0 to 100% RH
Accuracy:
±3% (from 20% to 80% RH)
Resolution::
±0.008% RH |
Range:
300hPa to 1100hPa
Absolute Accuracy:
±0.6hPa (0°C to +60°C)
Relative Accuracy:
±0.12hPa
Resolution:
±0.18Pa |
Resolution:
0.08% (typical) 0.11% (max)
Noise:
1.5% RMS (typical) |
I2C/SPI | BME688 Datasheet (PDF) |
MCU & Transceiver
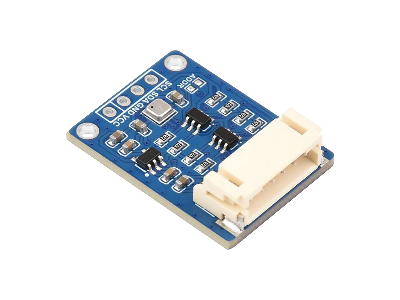
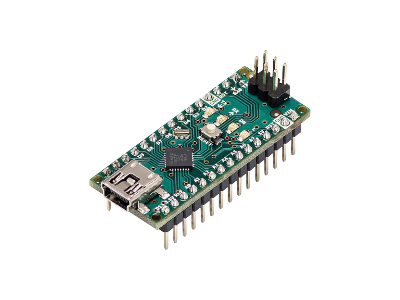
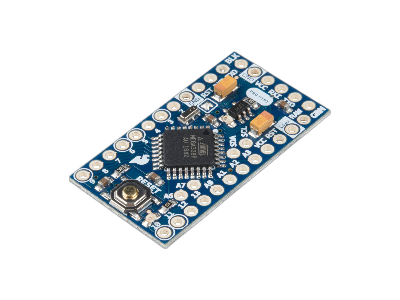
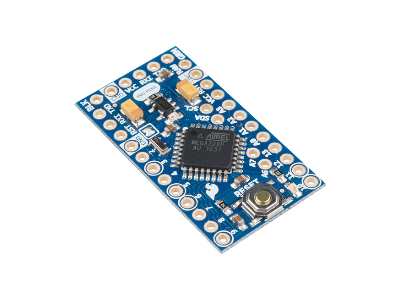
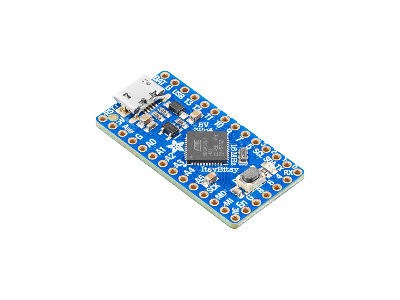
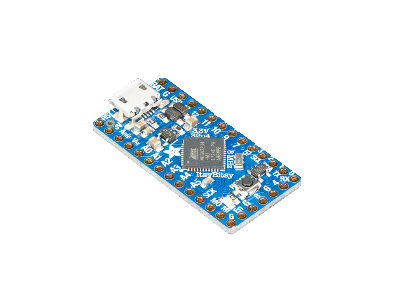
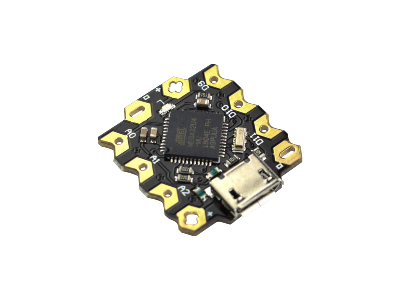
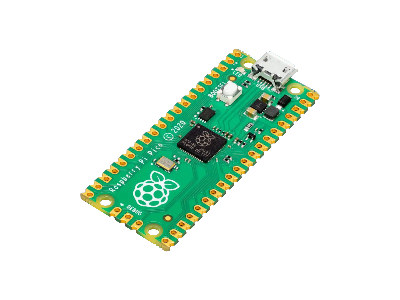
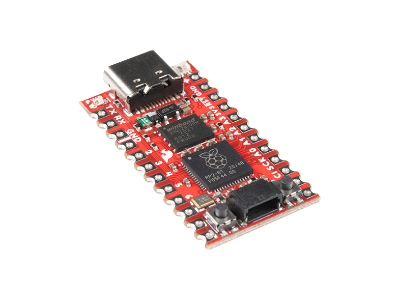
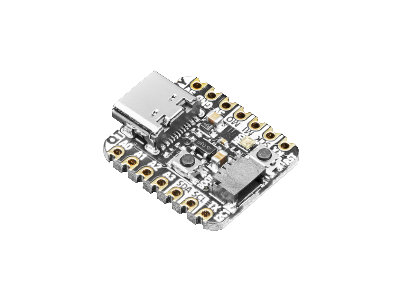
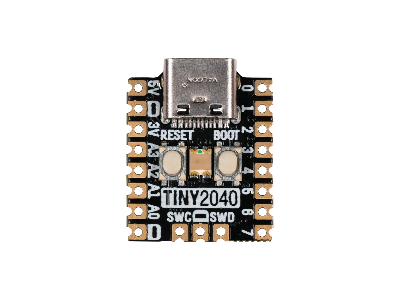
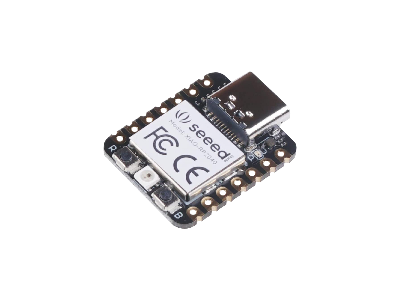
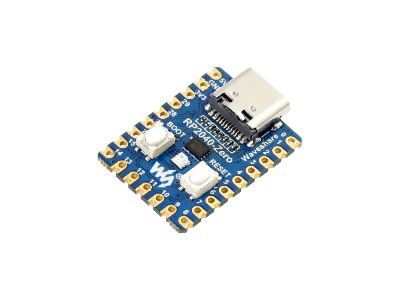
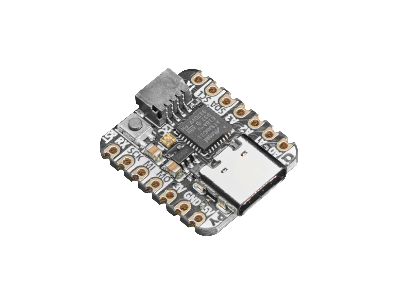
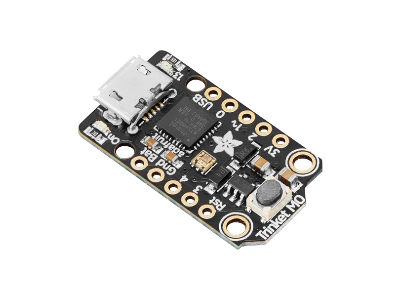
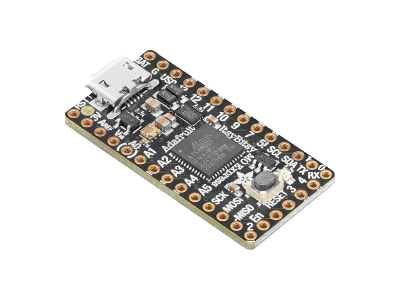
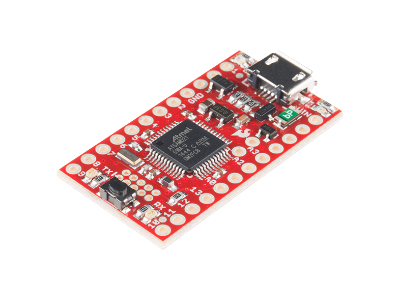
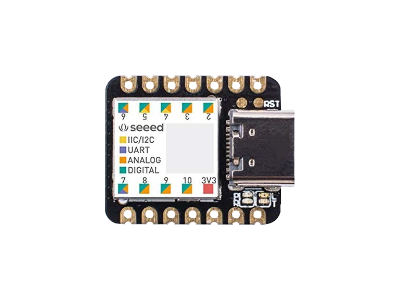
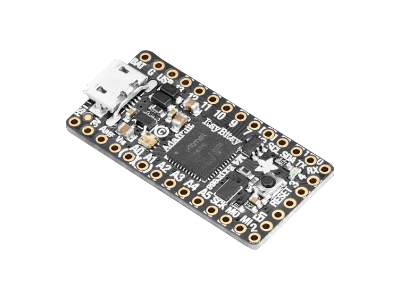
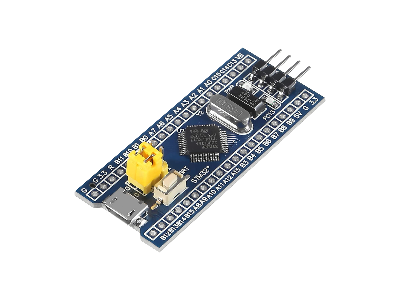
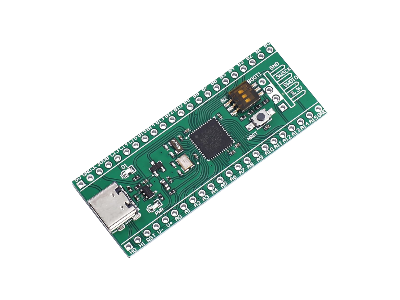
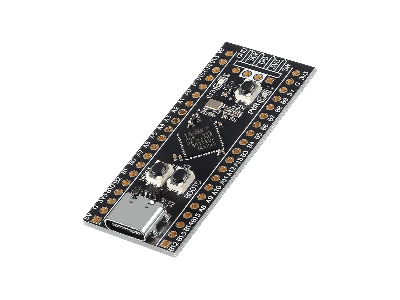
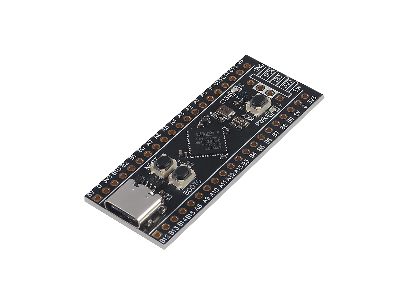
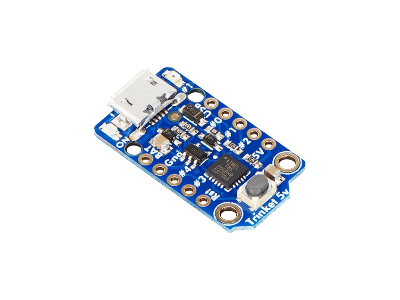
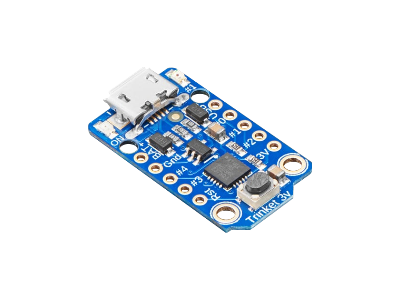
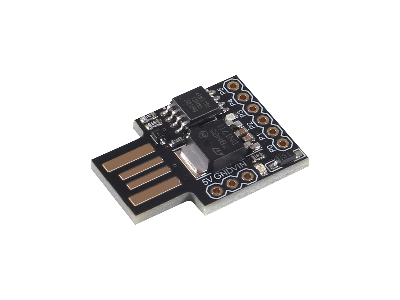
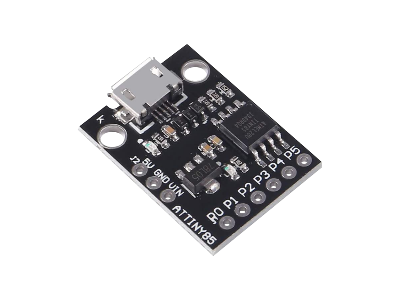
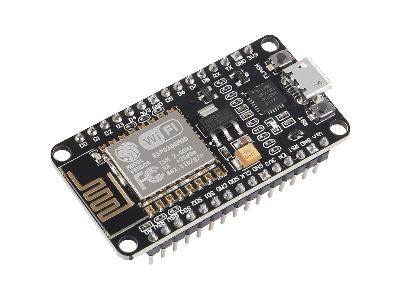
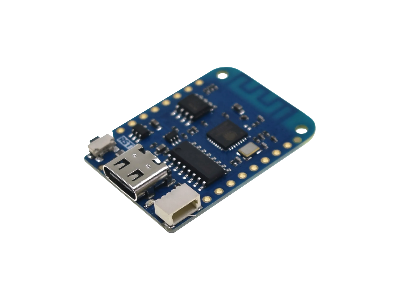
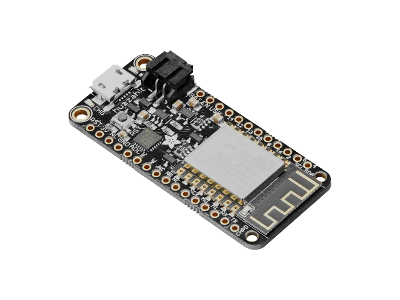
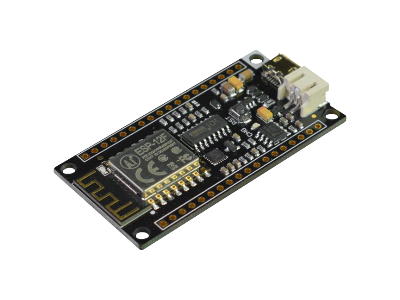
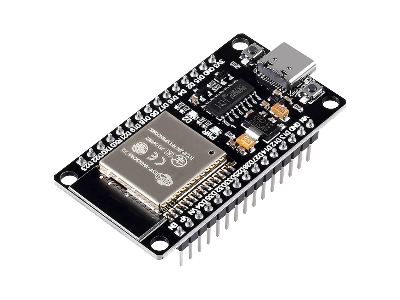
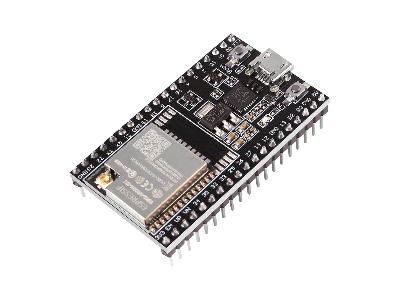
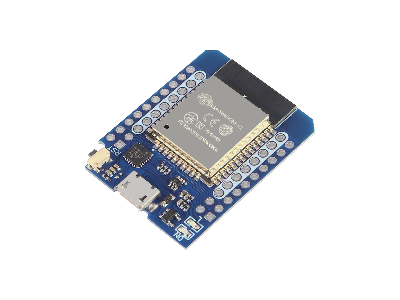
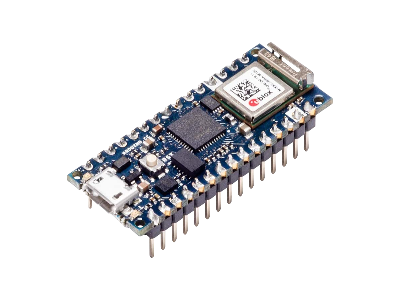
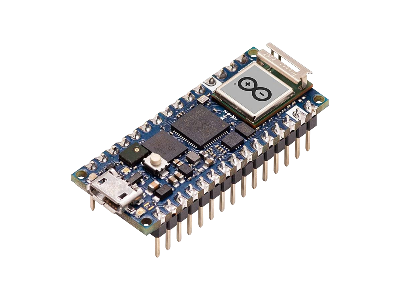
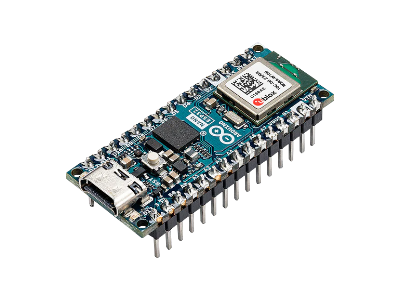
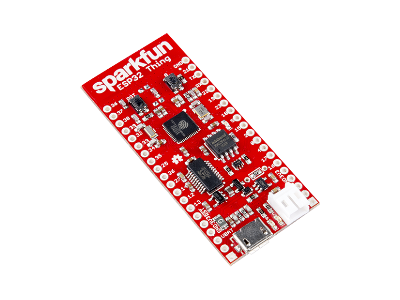
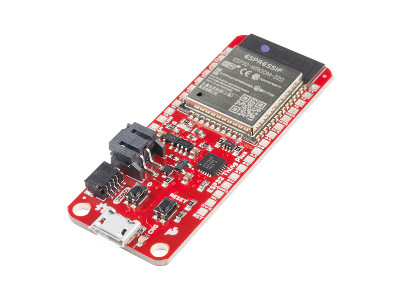
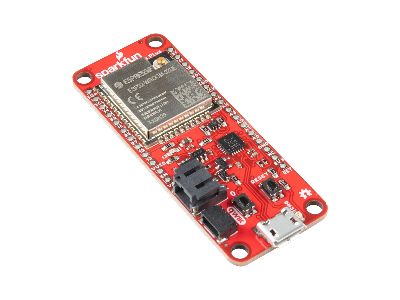
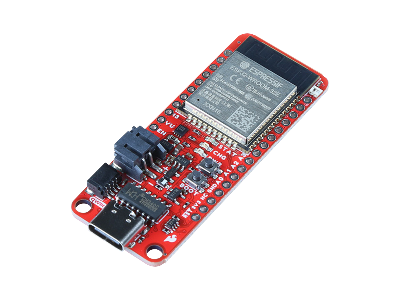
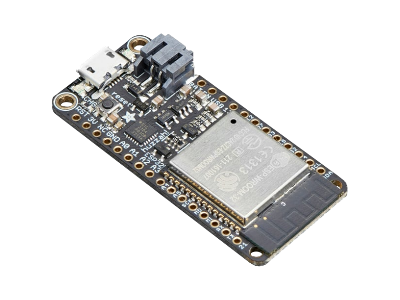
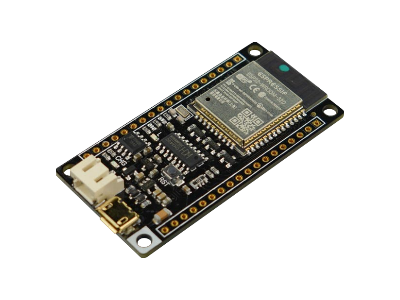
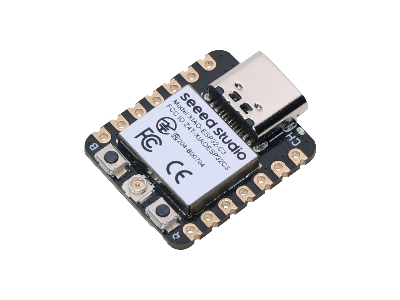
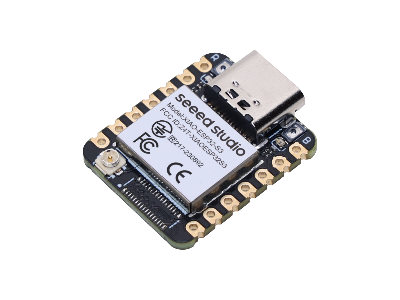
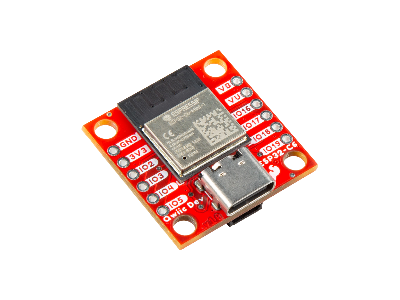
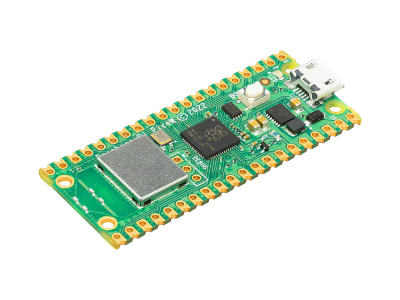
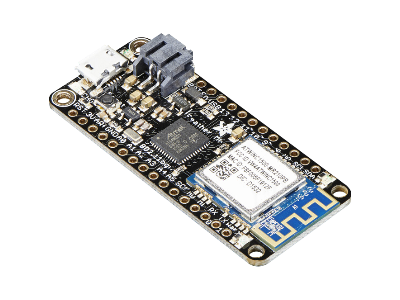
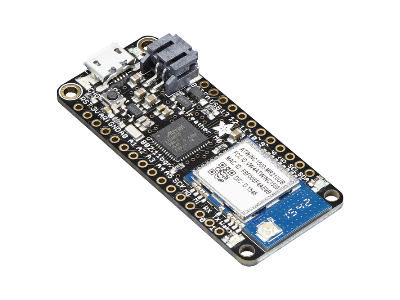
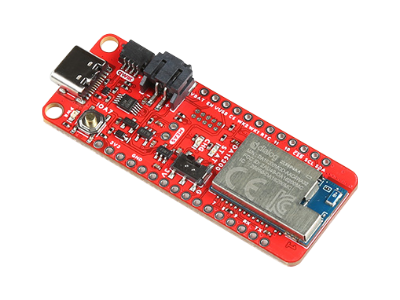
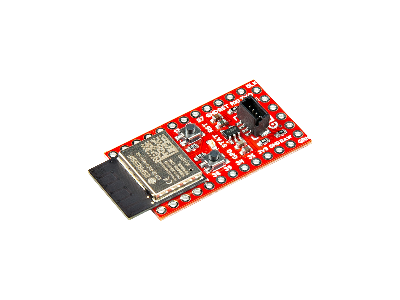
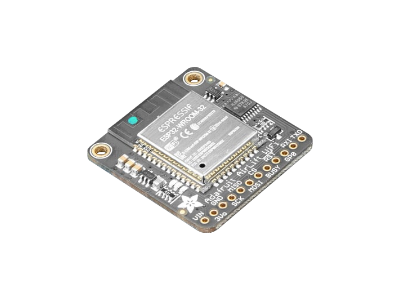
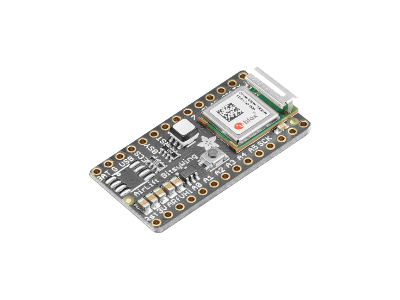
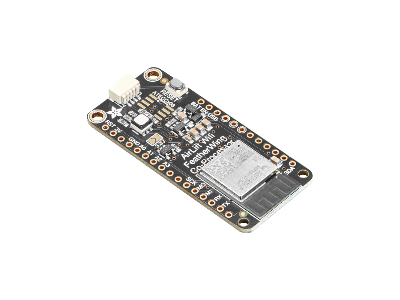
The output signals from the environmental sensors discussed here all have very low data rates, so you don't need a high end microcontroller for processing the data. A low speed microcontroller with a few I/OInput/Output ports and small size will do the job, such as any of the options listed below.
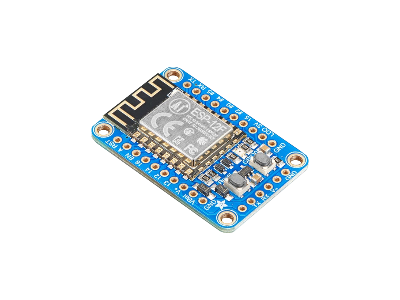
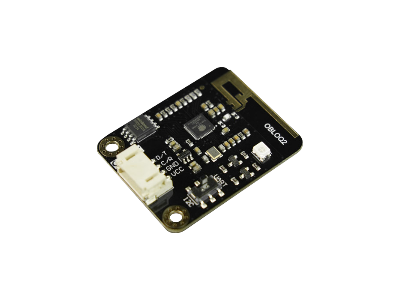
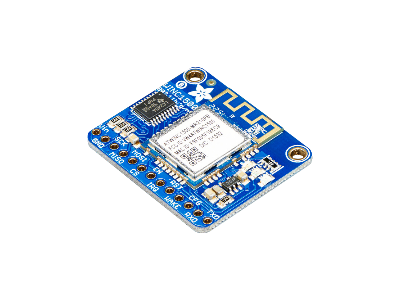
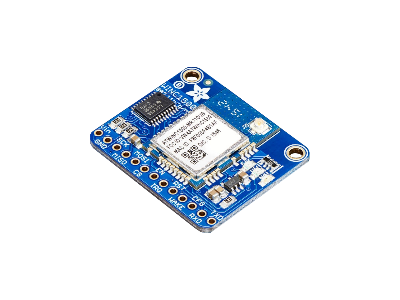
A transmitter and receiver (or both combined in a transceiver) is needed for wireless communication. Many microcontroller boards have a WiFi transceiver integrated into the board, which would be the simplest setup.
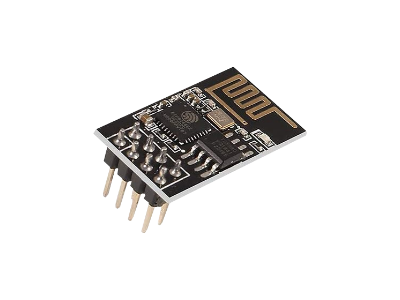
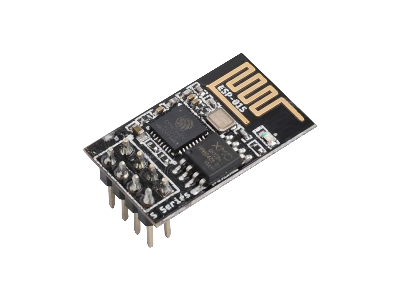
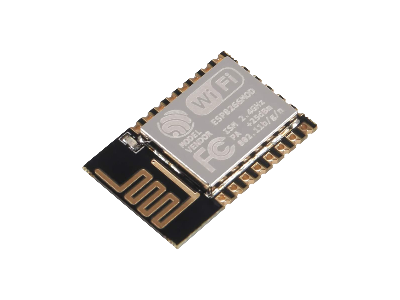
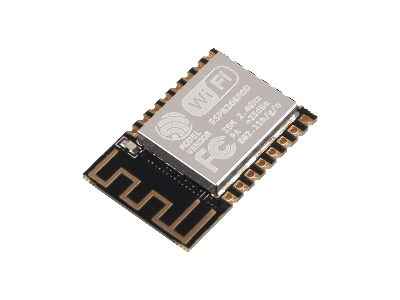
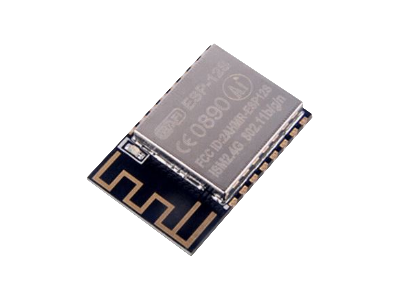
Alternatively, you could connect an external WiFi module to the serial port of the microcontroller to establish a WiFi connection.
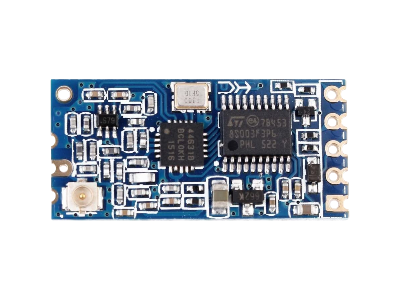
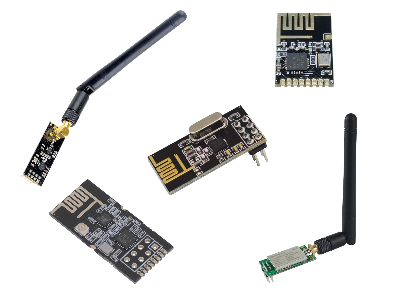
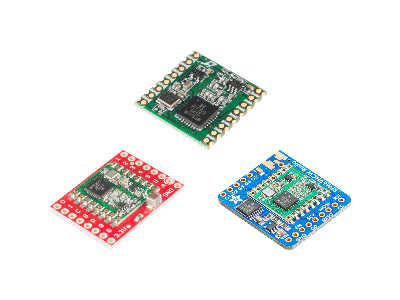
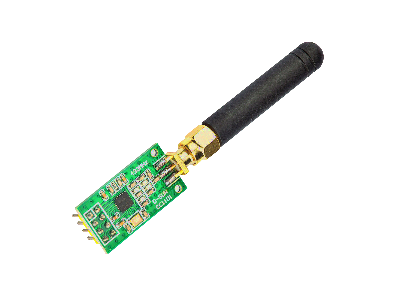
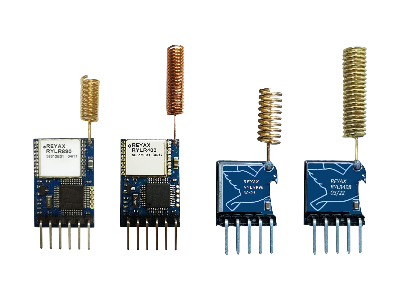
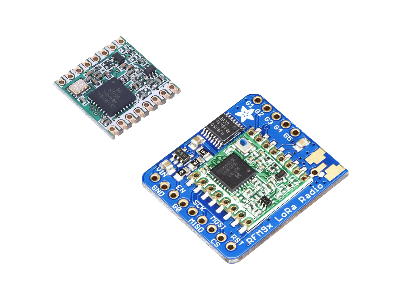
Another option is to use an RFRadio Frequency transceiver module to transmit data to the computer. Using RF modules would require more hardware compared to WiFi, since most computers already have WiFi, but RF modules generally have greater range, less power consumption, and are less prone to interference and/or traffic over your WiFi network.
You would need at least two RF modules, a transmitter connected to the microcontroller at the sensor and a receiver connected to the computer. RF modules transfer data to a computer over a UARTUniversal Asynchronous Receiver-Transmitter or SPISerial Peripheral Interface interface, which most SBCSingle Board Computers have, but if the computer does not have this interface then a conversion to USB with a microcontroller or USB Serial Adapter can be used.
Communication
When designing a monitoring system where an environmental sensor with a microcontroller communicates with a computer or other device, some requirements need to be established on what data content will be exchanged and when that data is sent. Some things to consider are the following:
- Data transmission and communication failures
- Control of the measurement sampling rate
- Sensor health status
- Disabling/Enabling sensors remotely
Data Transmission
Measurements of Temperature/Humidity/Pressure/Air Quality can be transmitted immediately when they occur so you can monitor and be alerted in real-time. If the communication fails, the data can be stored in the microcontroller memory temporarily while it continues trying to send the message until it is received. When the communication is successful, the record in the microcontroller memory can be cleared.
Measurement Sampling Rate
The rate at which the environmental measurements are sampled should be controllable from the computer so you can change it without reloading the embedded software on each microcontroller connected to the sensors. This means the embedded software on each microcontroller should include the capability of accepting commands from the computer to adjust the sensor sampling rate.
Sensor Health Status
If your sensor or microcontroller stopped running for some reason, you would have no way of knowing without some kind of periodic operational health status check. If the sensor and microcontroller is powered from a battery or has a backup battery, then the battery level should also be checked periodically.
How often the health status should be sent depends on your sensor and microcontroller power consumption requirements: more frequent status checks will consumes more power. You can setup the microcontroller to send the status over regular intervals like a beacon or you can ping the microcontroller from the computer or other device.
One advantage of the beacon approach it can provide a status over smaller time intervals (e.g., every second) if power consumption is not an issue. The advantage of pinging the microcontroller status from the computer is when and who to ping can easily be adjustable in the computer program for all your sensors, which avoids sensor transmission collisions when you have multiple sensors sending their status at the same time.
Disabling/Enabling Sensors
There are circumstances where you would want to temporarily disable a sensor from the computer or remotely, such as when making adjustments to the sensor or system. The embedded software in the microcontroller can be setup to accept a wireless command that would turn off sensor readings until another command is received to turn it back on.
Computer
The computer receives data from all the environmental sensors from a WiFi or RF receiver, reads in the data with a software interface, records the data, and can display the results on a monitor with some kind of dashboard.
If you don't have a computer available, it's worth mentioning that some WiFi microcontrollers, such as the ESP32 and the RPi Pico W, can also have a web server on them to create a web page displaying sensor results to your devices (phone, computer, tablet) over your network. Storing data on the microcontroller is limited, but you could store more data on an external SD card with a module or a USB flash drive with a USB host board.
Hardware
The computer hardware constantly monitors for any transmissions of measured environmental data and records the data. This means that the computer needs to be on 24/7. A desktop computer will work if left on all the time, but are often used heavily on a daily basis which may be an issue sharing resources and updating the operating system constantly would interrupt your monitoring system.
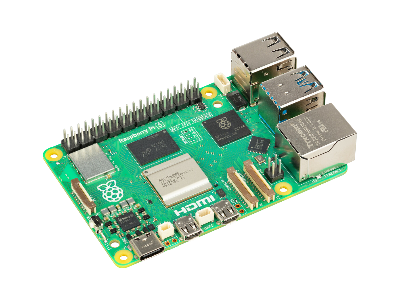
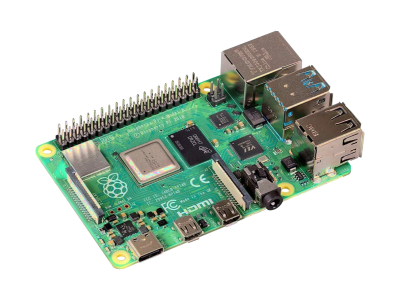
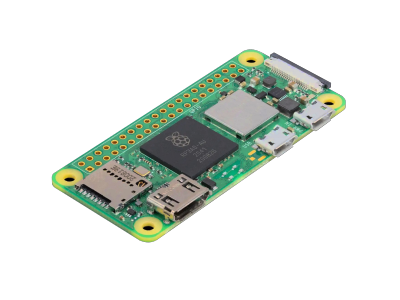
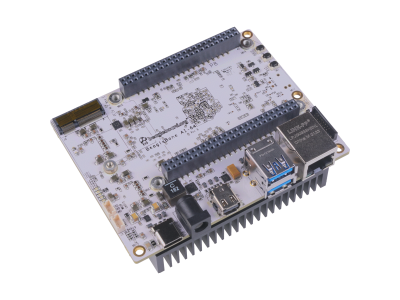
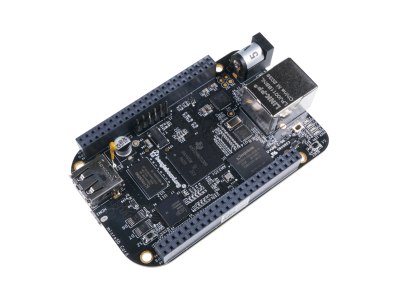
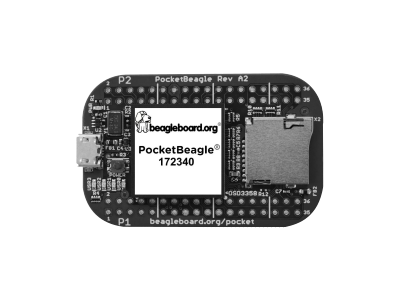
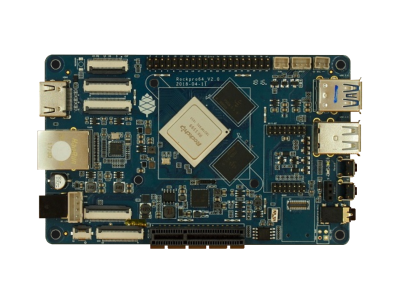
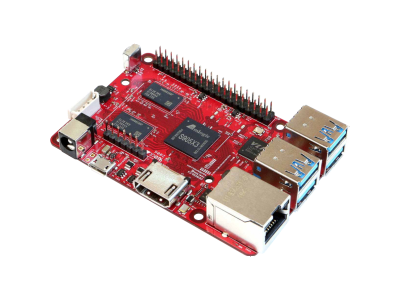
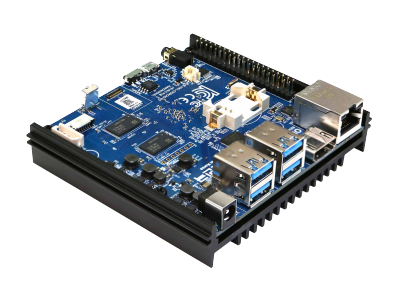
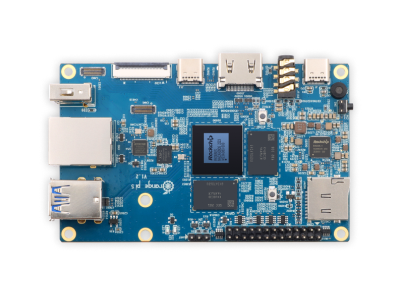
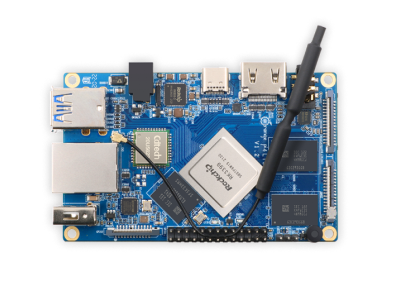
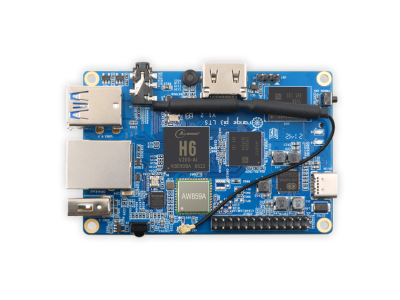
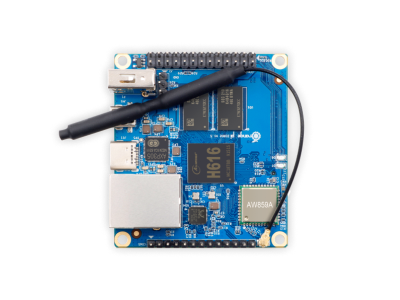
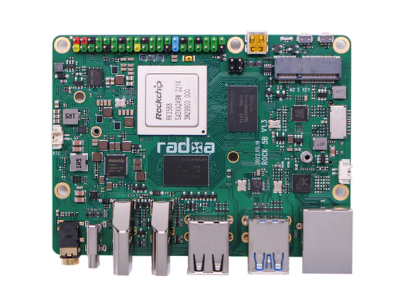
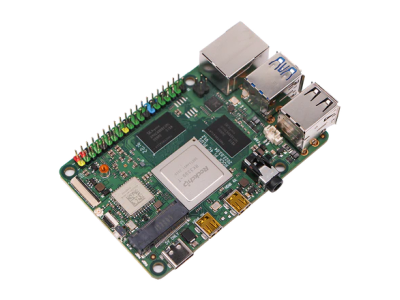
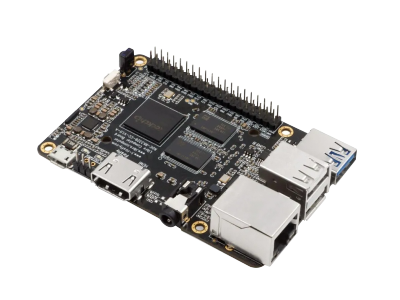
Single Board Computers (SBCSingle Board Computers) are relatively inexpensive compared to desktop or laptop computers, have a small form factor, can be left on all the time, don't require as many updates, and are typically not used for daily activities as much as a desktop computer. SBCs also consume a lot less power than a desktop computer and can last much longer on battery backup in the event of a power outage.
Software
The computer software can be designed to continuously read in the transmitted environmental sensor data, record the data, and display the results. The software can also be programmed to control the behavior of the sensors, such as changing the sampling rate, turning it off/on, or setting specific time intervals to make measurements.
I/O Interface
RF Interface
For RF modules the receiver is usually connected serially to the computer. This can be done directly through a UART/SPI interface on the GPIOGeneral Purpose Input Output of a SBC or through USB with a microcontroller or USB Serial Adapter. To collect data from the UART/SPI/USB port on the computer you can use the Python PySerial software interface. The functionality of this interface is described in more detail in the article Python PySerial I/O.
WiFi Interface
For WiFi communication, the software interface could be a TCP socket connection or a client-server configuration with the use of a standard protocol, such as HTTPHypertext Transfer Protocol, WebSocketWebSocket is a communication protocol, providing simultaneous two-way communication channels over a single Transmission Control Protocol (TCP) connection. WebSockets are typically run from a web browser connected to an application server that allows messages to be passed back and forth while keeping the connection open., or MQTTMQ Telemetry Transport (MQTT) is a lightweight publish-subscribe messaging protocol for small sensors and mobile devices, optimized for high-latency or unreliable networks. Historically, the "MQ" in "MQTT" came from the IBM MQ (then 'MQSeries') product line, where it stands for "Message Queue". However, the protocol provides publish-and-subscribe messaging (no queues, in spite of the name).. Since environmental data consist of short messages that have a low bandwidth, MQTT is a good choice for handling a lot of overhead.
Graphical Interface
Software on the computer can be used for controlling and monitoring data with a desktop application GUIGraphical User Interface or web server developed by the language of your choice (Python, C++, Java, etc.). In Python, there are many desktop GUI frameworks you can use like TKinter, wxPython, PyQT, PySide 2, Kivy, PySimpleGUI, and PyGUI. All of these frameworks are cross-platform that work in Windows, macOS, and Linux. TKinter is a built-in module in Python and the easiest to get up and running and learn, has a small footprint, and is a good choice for small applications.
Another option for data monitoring is using a web page as the GUI from a server that can be ran locally or by a hosting service over the internet. The advantage of using a web page as the front end of a monitoring system is that it can be accessed remotely either by hosting it yourself using port forwarding on your local network or from a hosting service. Python has web frameworks such as Flask, FastAPI, or Django. Flask is the easiest to get setup and running (you can get set up with just a few lines of code).
An example of displaying data from environmental sensors is shown in the figure below. Gauge charts can be used to display the most current measurements. Time series plots can show measurements throughout the day or whatever time period you want. Monthly averages throughout the year can be shown as a bar chart.
Alert Notifications
When you are away from your computer, the server back end can include the capability of automatically sending alert notifications by email and/or text messages that you can see on your phone when any of the environmental measurements are outside their normal range. This additional feature of your monitoring system can be setup to allow you to turn the alert notifications on/off when not needed.
In Python you can automatically send emails using the built-in smtplib module and the ssl module can provide TLSTransport Layer Security encryption. If you are using a Python web framework (Flask, FastAPI, or Django), there are extensions for these frameworks that can send the email for you. For example, Flask has the extension Flask-Mail to automatically send emails.
Text messages can be sent using services such as Twilio or Textbelt, but they can also be sent for free through your email server with SMSShort Message Service Gateways using the same routines used for sending emails.
Conclusion
Implementing an environmental monitoring system gives you the capability of recording indoor or outdoor temperature, humidity, pressure, and air quality. The hardware in this system includes sensors, microcontrollers, transceivers, and a computer.
Sensors are chosen based on what you want to measure from the environment and other requirements of the application (ease of use, accuracy, power consumption, etc.). You can measure ambient temperature, humidity, pressure, and air quality separately with different sensors or all in one module.
Recording environment measurements on a computer connected to a network offers the capability of software to automatically send an alert notification by email and/or text messages that you can see on your phone when any of the environmental measurements are outside their normal range.








(0) Comments
Sign in to leave a comment
Sign In